Map Location: Drawer 7, No. 22
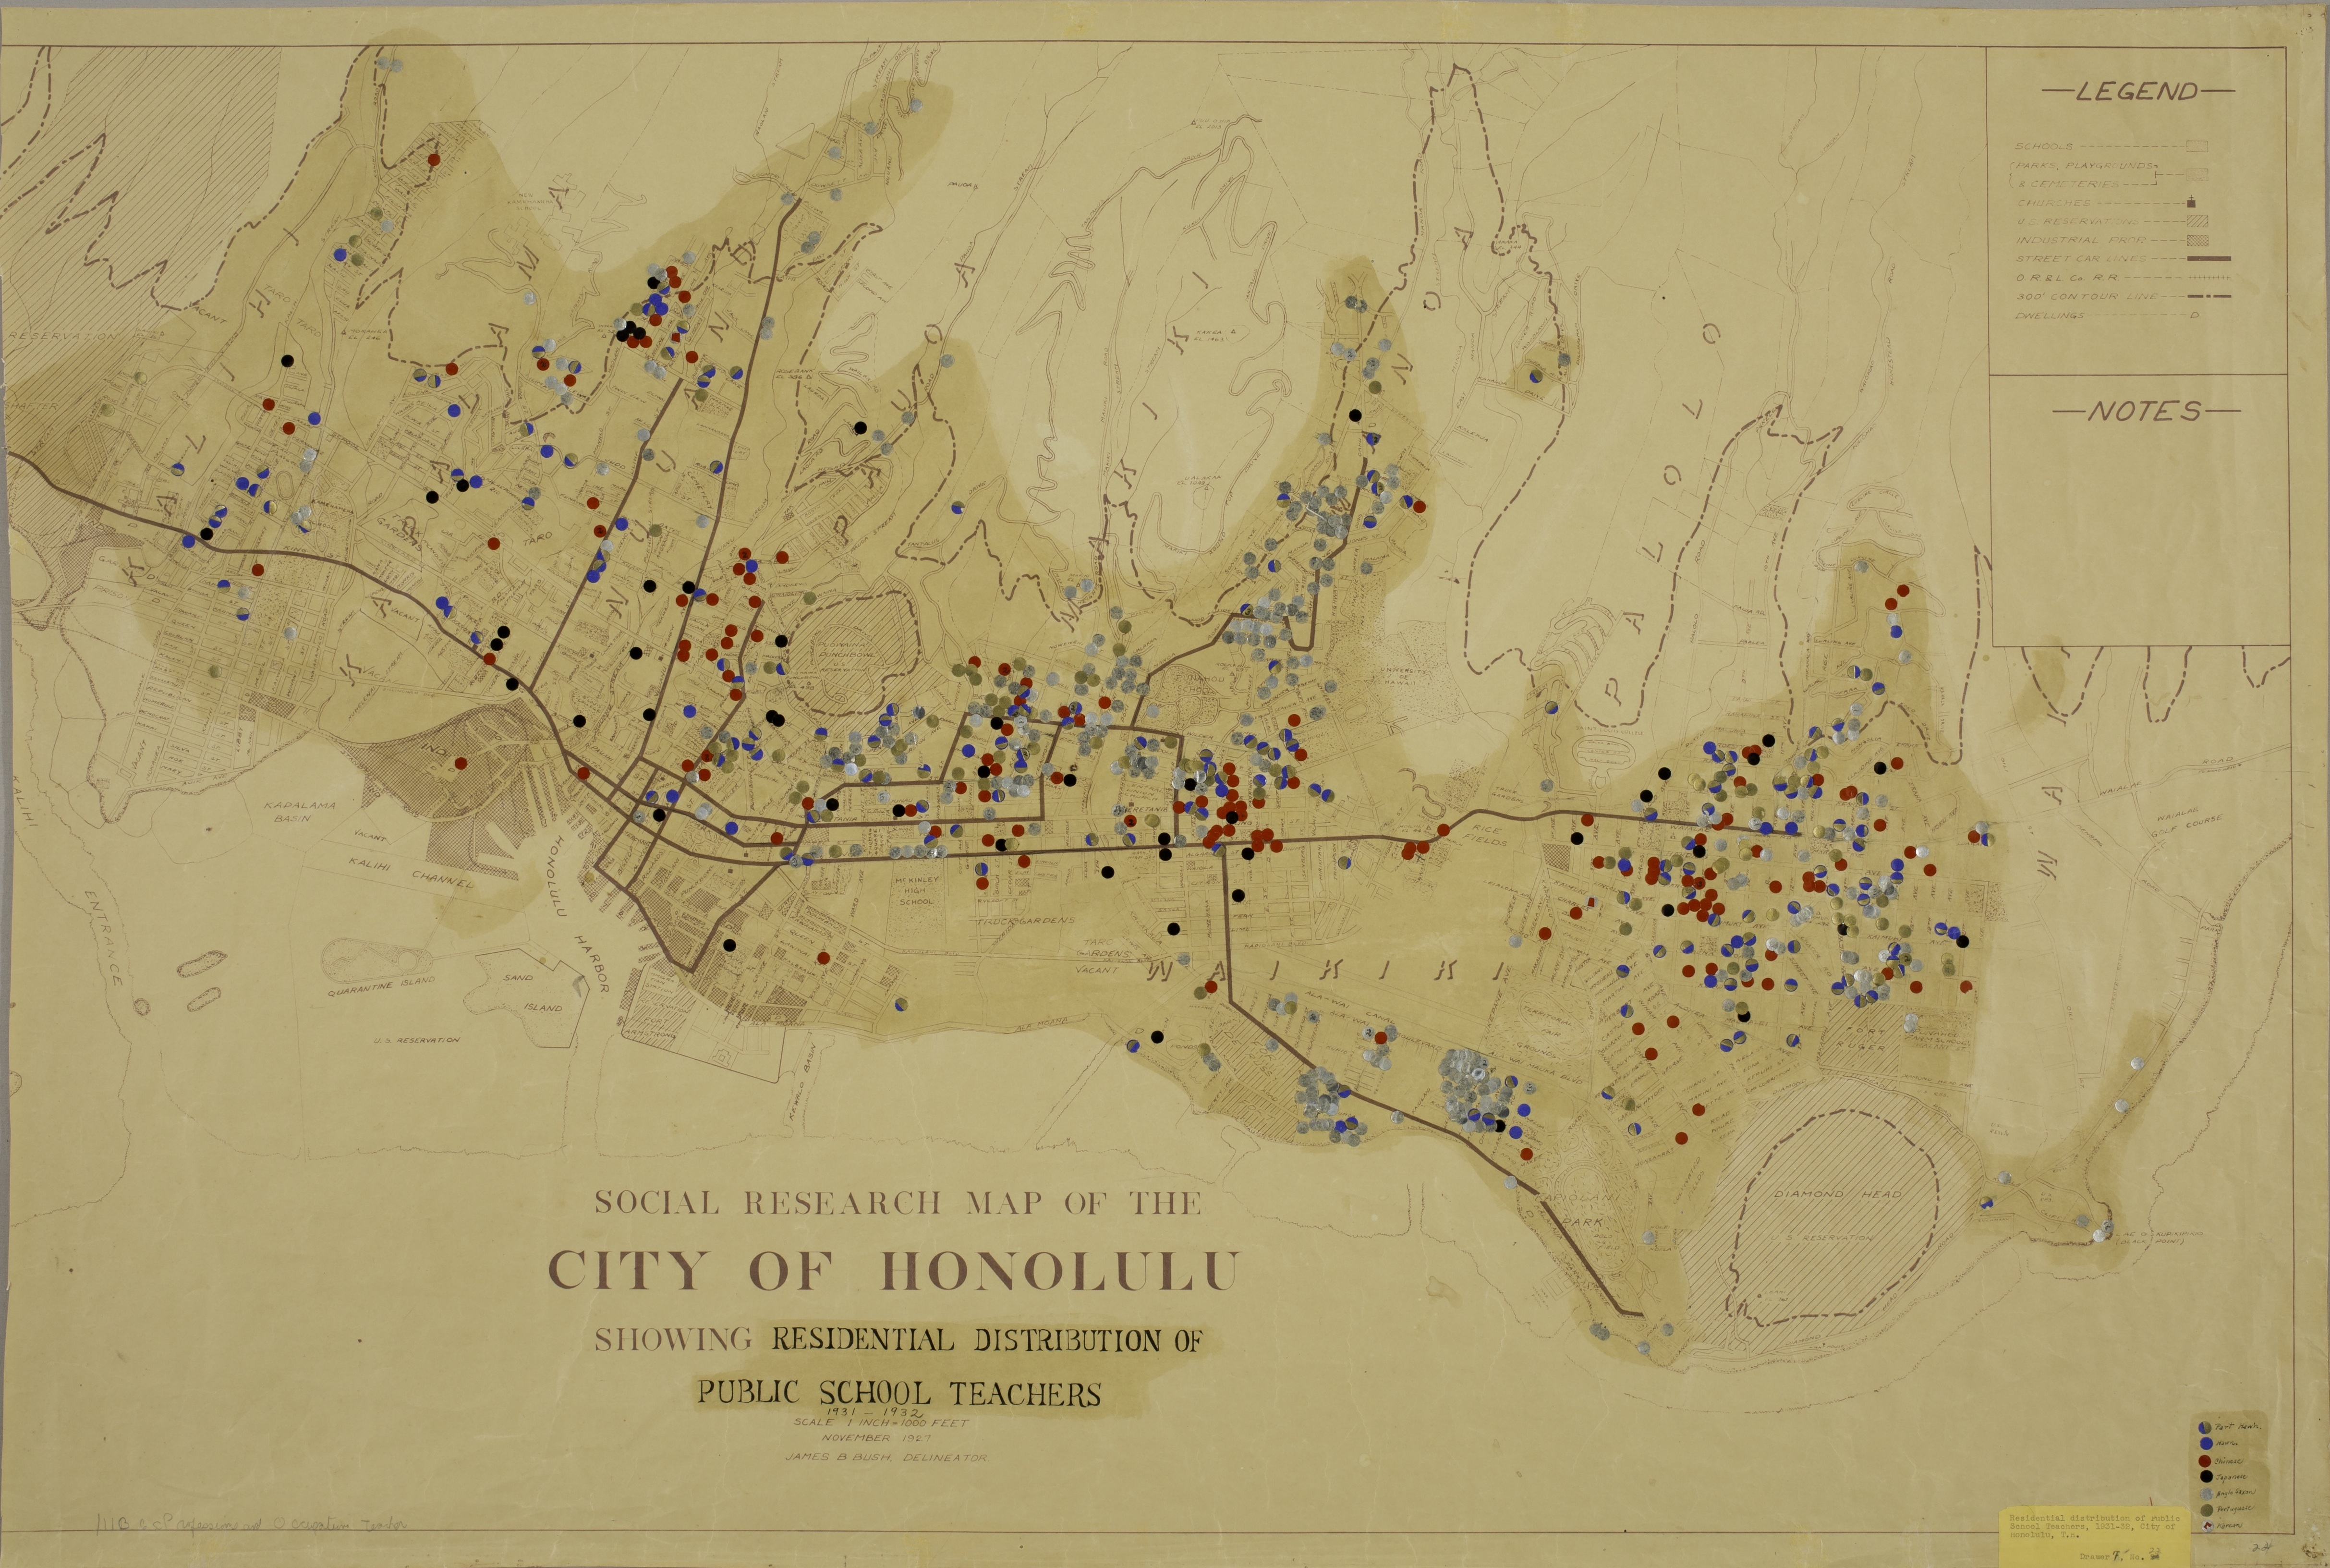
This map is an “orphan.” There is no accompanying paper or companion map so it is difficult to analyze. Where teachers lived seems superfluous and with no explanation or context, the information doesn’t answer any compelling questions about the state of education in the Territory. But as we know, information about race in Hawai‘i is always relevant, even if it only tells us how important race was to the RASRL sociologists.
The map is one of the many oversized maps (approximately 31 inches x 46 inches) in the collection. These larger maps were commercially produced; the researchers recorded their data over the general outline of the city. In this case, the data were recorded by “scatter plotting,” colored dots that showed the distribution of teacher residences. The dots correspond to the racial groups as follows:
- Blue = Hawaiian
- Blue+Gold = Part Hawaiian
- Red = Chinese
- Black = Japanese
- Silver = Anglo-Saxon
- Gold = Portuguese
- Silver + Red = Korean
The age of the map and the overlapping dots make it difficult to count the actual numbers, but our best guess is as follows:
- 44 Hawaiians (3%)
- 21 Part-Hawaiians (18%)
- 155 Chinese (20%)
- 41 Japanese (5%)
- 354 Anglo-Saxon (Haole) (45%)
- 66 Portuguese (8%)
- 2 Korean
It is not clear how the mapmakers obtained this information. Officially, the Department of Public Instruction (DPI) stopped keeping (or making public) racial data on teachers in the late 1920s, but it is unlikely that there was any other readily available source. We can, however, compare these data to previous years when racial data was published in the annual report of the DPI to the Governor. For example, the chart below shows the racial background of all the teachers in the Territory for the 1925-26 school year.
Teachers in Service (2,141 teachers)
| Hawaiian | 89 | 4.15% |
| Part Hawaiian | 422 | 19.71% |
| Portuguese | 192 | 8.9% |
| Spanish | 9 | .42% |
| Haole (Other Caucasian) | 953 | 44% |
| Chinese | 274 | 12% |
| Japanese | 193 | 9% |
| Korean | 7 | .32% |
| Negro | 2 | .09% |
“Report of the Superintendent of the DPI for 1925-26” (dated January 21, 1927)
In both cases, Haole teachers dominated the profession, followed by Hawaiians. (The distinction between “Hawaiian” and “Part Hawaiian” was based on the idea that blood quantum determined who was or was not Hawaiian. Whenever possible we choose to combine the figures for these groups and treat Hawaiians as a single ethnic group.) Chinese teachers were the third most numerous. Haole, Hawaiians, and Chinese were the three oldest ethnic groups in the Territory and so were more heavily represented in middle-class professions like teaching. The Nisei who were beginning to enroll in large numbers in the University and Teachers College were not yet present in substantial numbers.
Social Historical Context
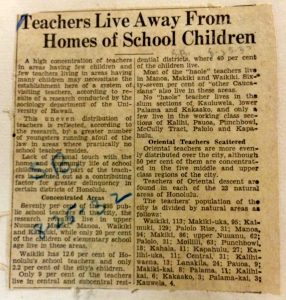
An article that appeared in the Honolulu Star-Bulletin on August 25, 1932 reported that “Teachers Live Away from Homes of School Children.” The article showed a chart that supported this gripping news and reported the following facts:
- The majority of teachers lived in Nu‘uanu, Makiki, Mānoa, Waikīkī and Kaimukī where 67% of the Haole residents of Honolulu lived
- Only 22% lived in Central Honolulu
- Waikīkī had 12% of Honolulu’s school teachers and only 2% of the city’s children
- Only 9% of teachers lived in “Central” and “Subcentral” residential districts where 40% of children lived
- The writer continued: “Oriental teachers are more evenly distributed over the city, although 50% of them are concentrated in the five middle and upper middle class regions of the city.”
The writer doesn’t provide any analysis or further discussion; it is a straightforward statement of fact. Nor does the article explain where the information comes from or why it is being reported on. However, since it very much resembles “Residential Distribution of Public School Teachers,” we have reason to believe that the article was reporting on research done by members of the Sociology department at the University of Hawai‘i.
In a previous post at Thinking Locally, we discussed this map, focusing on the history of teacher training in Hawai‘i that ended in 1931 with the absorption of the Normal School into the University that created the Teachers College. In this post we focus more narrowly on the map itself and speculate on why it would have been created.
Race plays an important role in the history of education in Hawai‘i. Who was teaching was as important as what was being taught. Although leaders in education in Hawai‘i were usually progressive in their vision and attitudes, their policies often reflected the benign bigotry and perfunctory privilege that were common at the time. White teachers were often preferred because they had better training or skills. Many came to Hawai‘i with a B.A. from a university, a credential that qualified them to teach high school. But White teachers were also assumed to be superior to local teachers because they exemplified how to be American, how to speak Standard English, and their innate ability to express American values and patriotism.
Haole teachers were the largest single group of public school teachers for many years and the map visually emphasizes this fact. Not surprisingly they lived in Haole neighborhoods. There may have been many reasons for this. Some White teachers who came from the continent stayed only for a year or two. Teachers who were sent to rural districts or the neighbor islands were often housed in a teacher’s cottage, sharing a small house with two or three of their colleagues. (This situation was described in a Thinking Locally post about Zonita Owens.) In Honolulu, housing was not provided. Without local contacts, White teachers from the continent may have received recommendations from their colleagues or offered lodgings with a family or in a boarding house that catered to Whites. They could have found a home or apartment to rent in new developments like Kaimukī or Waikīkī. Housing along the streetcar lines running up to Mānoa was especially desirable. Local Haoles were in a position to educate these newcomers and alleviate their anxiety about becoming a highly visible racial minority. Most newcomers were quite surprised to find themselves in a place that in no way resembled their hometowns in the United States. Haole teachers lived in Haole neighborhoods because those were the places where they were welcomed and could learn how to navigate Hawaii’s multicultural environment.
Teaching as a path to the middle class
In her 1929 M.A. thesis, Ruth Shaw described the typical product of the Territorial Normal School:
The outstanding characteristics of the product of the Territorial Normal and Training School can best be summarized by an imaginary composite picture … She is of part Hawaiian and Oriental ancestry. She was admitted to the training after having finished the course at a public high school, probably McKinley. Those entering from high school with her were mostly Chinese and Japanese. Upon the completion of the two-year course she was graduated with a diploma from the primary curriculum. … Since then she has entered the employment of the Department of Public Instruction where she and her sister graduates are in the majority. She has married and established her home, but continues on in the service. As a teacher, she has only lower-division collegiate standing, and has enrolled in the extension courses, hoping soon to complete the work on her collegiate diploma and eventually to receive her college degree. She has no aspirations for a principalship, but is busy as a grade teacher, drawing the maximum salary each month [$150] and trusting that she is giving satisfaction to the Department of Public Instruction.
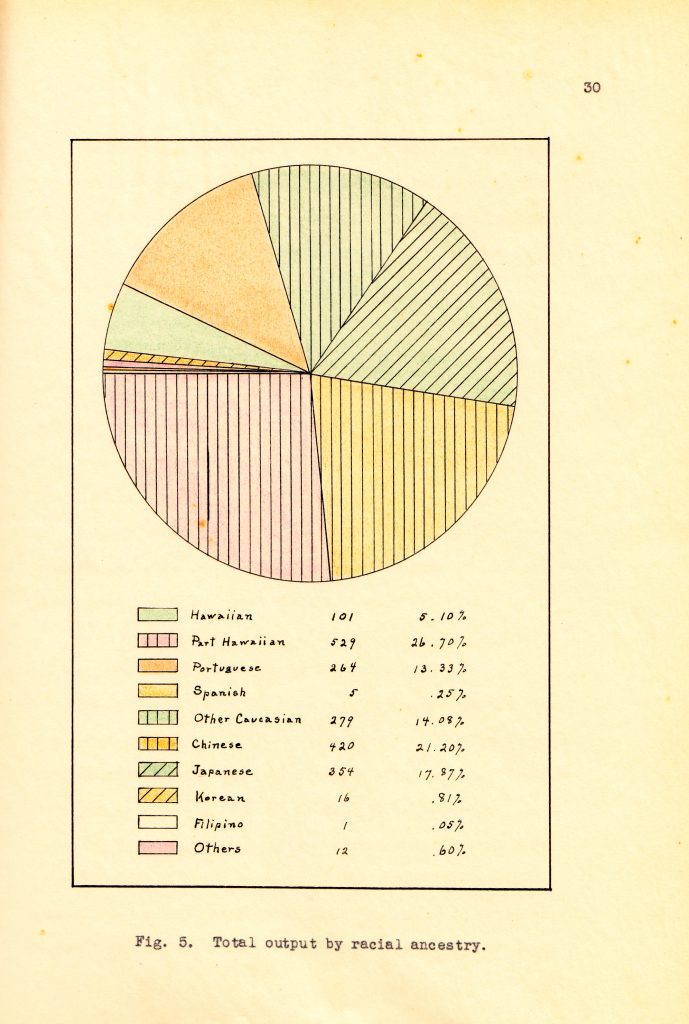
Shaw’s thesis, “The Output of the Territorial Normal School,” analyzed what she called “the school product,” i.e., teachers, who they were and how they were trained. What she found was that in its thirty-three years of existence, the Normal school had trained 1,981 teachers. Approximately 32% were Hawaiian or Part Hawaiian, 21% were Chinese and 14% were Haole. However, in 1925-26 (the last year in which these figures were published in the DPI’s annual report to the Governor), the Department of Public Instruction teaching staff was 23% Hawaiian or Part Hawaiian, 12% Chinese, and 44% Haole. The numbers on this map show a similar racial distribution: 21% Hawaiian or Part-Hawaiian, 20% Chinese, and 45% Haole. Two conclusions are clear: the DPI favored the hiring of White teachers and that many of those teachers were not from Hawai‘i or at least were not trained at the Normal School.

Ruth Shaw, ““Comparison of the Racial Ancestry of Normal Graduates in 1929, the Public School Teachers in 1925-26, the Public School Children December 31, 1929 and the Territory, 1929.” MA Thesis, University of Hawai‘i, 1929
The Territorial Normal and Training School merged with the University of Hawai‘i in 1931, completing a multi-year process designed to professionalize the training of teachers. The responsibility for their education was shifted from the public school system to the University. From 1931 on, anyone who wanted to become a licensed teacher had to be a college graduate, a significant elevation in the standards required to work in Hawaii’s public schools. This also elevated the status of teaching as a profession.
Teaching had always been one of the few professions open to women, but as college graduates, teachers became members of the middle class. In 1929, the annual salary for an elementary school teacher was $1,657. A junior high school teacher made $1,737 and a high school teacher made $2,098 (Eileen Tamura, Americanization, Acculturation and Ethnic Identity, p. 233). This meant that a teacher had the potential to earn significantly more than her parents who worked on a sugar or pineapple plantation for $40 or $50 a month. A teacher made as much as someone working in the printing industry ($37 a month) and more than an employee of a foundry ($28 a month) or a dry dock worker ($26 a month) (“Labor Conditions in the Territory of Hawaii 1929-1930,” Bureau of Labor Statistics, p. 11).
RASRL Context
Although we know of no other maps that depict the residential distribution of a specific profession, it is in line with how sociologists (and therefore their students) saw and analyzed the world. Maps were a way of documenting change that according to the “ecological” model used by sociologists was the expected outcome of specific social forces. These changes could be monitored, measured, and documented. We see this in the smaller community maps that show the number of shops, the major institutions (churches, schools, and social organizations). Communities changed in a series of “successions” in which poor tenements were replaced by boarding houses and then single-family homes. The type of institution in a community was a reflection of which ethnic groups were moving in and out of a neighborhood – the Portuguese Catholic church replaced by a Buddhist temple, for example. These changes were a reflection of class and economic advancement in the community. Unless it was interrupted by unforeseen or unusual circumstances, such as an economic depression or war, the process would continue as expected.
There is much to critique about this model; it seems to assume that movement up the economic ladder was inevitable. It does not account for what we now see – the way that racism could disrupt this “natural” process. But one goal of the work of local sociologists was to show that racial diversity did not make Hawai‘i a threat to the racial order of the United States. The local population was being Americanized in much the same way that Swedes in Minnesota and Germans in Chicago were eventually assimilated into the mainstream of American life. The sociologists at the University of Hawai‘i and their students provided evidence of this process. From our vantage point, we look at this map and see de facto racial segregation that reinforced discrimination in other areas of local life. The creators of the map may well have been documenting change; what we now see is a static but nonetheless revealing picture of the past.

